Data Analysis Processing evidence of natural phenomena

Data Analysis Objectives
- Provide examples of different forms of data about the natural world, including the types of information data can convey.
- Discuss the techniques, benefits, and limitations of sampling from a larger population.
- Analyze different forms of population data including population distribution and population size.
In this Guide, both journal pages can be completed at the same time.
Overview of Guide 1B Journal Pages
Collecting data about a population
This week you are collecting data about a population of organisms. A population includes organisms that are all the same species. This could be a population of the same type of tree in a park, same species of grass in a lawn, ants in an anthill, or the same species of fish in a tank. There is more on what a population is in this guide.
Data Collection Plan
Choose a location with a population, determine the size of the smaller area you will sample at that location, design a quadrat to sample with, list any other supplies needed, and identify potential safety issues.
Quadrat Data Results
Collect information about the population, including: researcher name(s), project name, location, weather, date, time, the number in the sample quadrat, the extrapolated number in the entire location, distribution, and interactions.

Data are the attributes of something we can observe, like number, color, or size. Data is the variable in a study, what you are trying to find out more about; like the number of fish in a lake, or location of a plant in a field.

“Data” is often used interchangeably with information. In its basic sense, data is the attribute of something, like the number or color, or size. This is information if it is new to someone, they become informed about the data.
We often think of numbers as the primary type of data, because many measurements are numerical.

Temperature

Stock Values

Mutation Rates

Food Calories

Map Coordinates

Population Size
Data can also be in non-numerical form.

Specimens

Human Attributes (motivation, attitude, satisfaction)

Stakeholders in an Issue
The questions that you want to answer drive the type of data that is collected.
This video provides an overview of data collection.
For this guide’s journal assignments, you will be researching a population’s size, distribution, and interactions.
A population is a group of organisms that are part of the same species and have the potential to interact.
Sampling
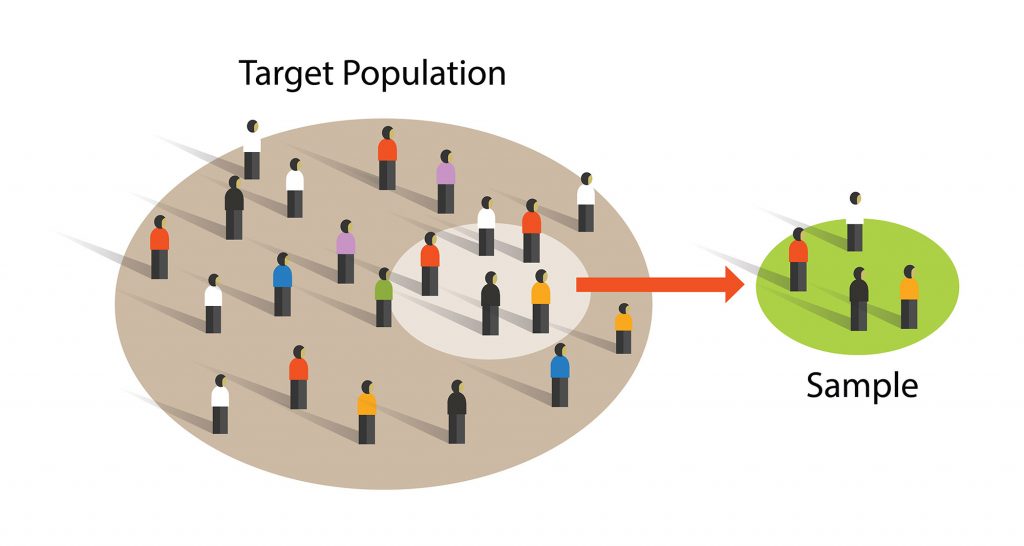
It is usually impossible to study all of something. For example, it would not be possible to study all of the monarch butterflies. Sampling is a way to study a subset of organisms and then try to extrapolate to the larger population.
In the Willamette Valley, a sign of fall is the return of Dusky Canada Geese populations from their summer breeding grounds in Alaska. We’ll have more on the geese in an upcoming guide.
Dusky Canada Geese

Researchers rarely get the opportunity to sample an entire population, unless it is quite small, like an endangered species or a tiny habitat.
A sample is a smaller part that is intended to accurately describe the larger whole.
Sampling a small defined number of individuals and extrapolating the results to the larger population is a common practice in many fields.
What is an advantage of sampling?
hint: if you were asked about characteristics of a grass species in a large lawn, what is the clear advantage of taking a smaller sample?
What is a potential disadvantage of sampling?
hint: think about if by chance you get something unusual in the sample, the assumption would be that whatever that is, is actually common.

A larger number of samples in an area typically provides a more accurate representation.

Resources (materials, time, money) and weather often limit sample number and sizes.

In our field work (streams for Lesley; lakes and forests for Mark), weather and time were often the limiting factor. As graduate students our labor costs were inexpensive, but the time window to collect seasonal data was narrow.
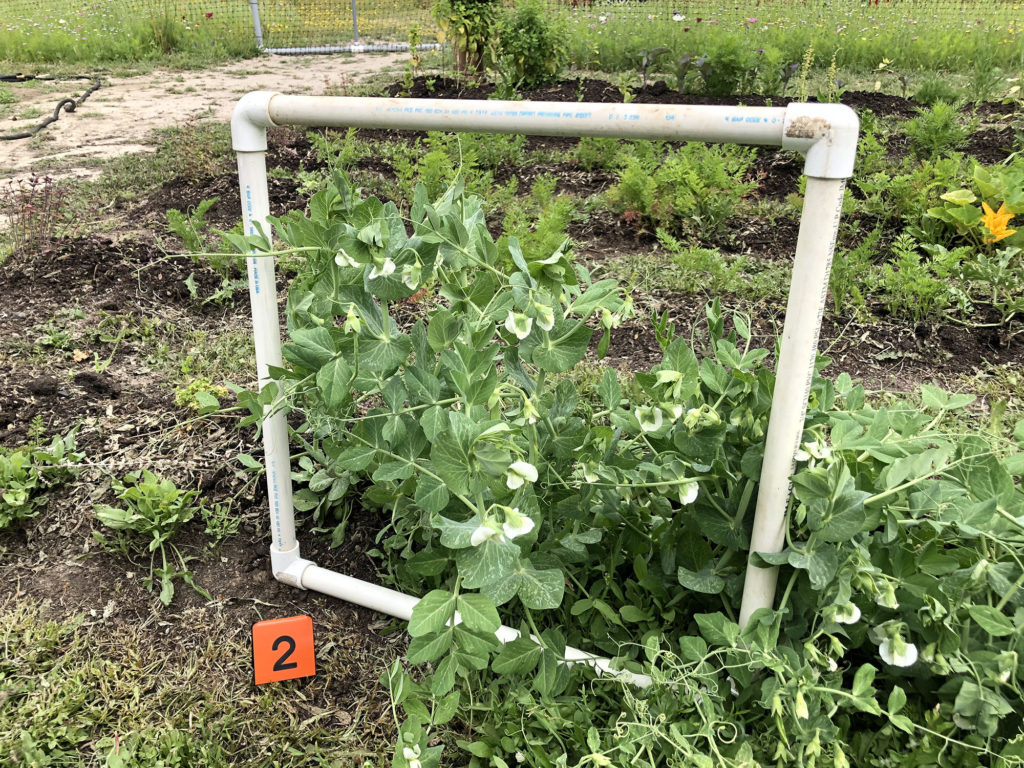
A quadrat is often used to delineate a consistently sized sampling area and can be inexpensive to construct.
Besides size, another characteristic of populations is distribution of the organisms.
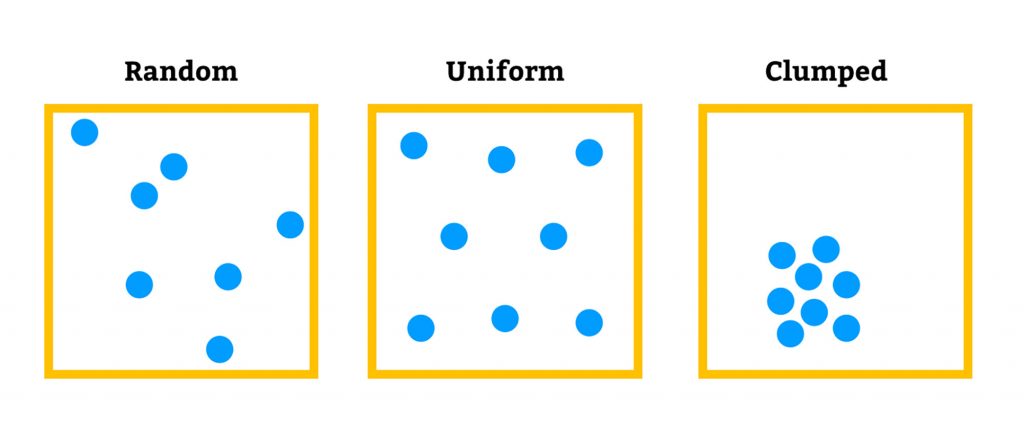
The blue dots in the image represent individuals in a population.
The meerkats in this photo are demonstrating _____ distribution.
answer: very clumped

Another form of population data is the type of interaction between organisms, either within a species or between species.
Commonly observed interactions
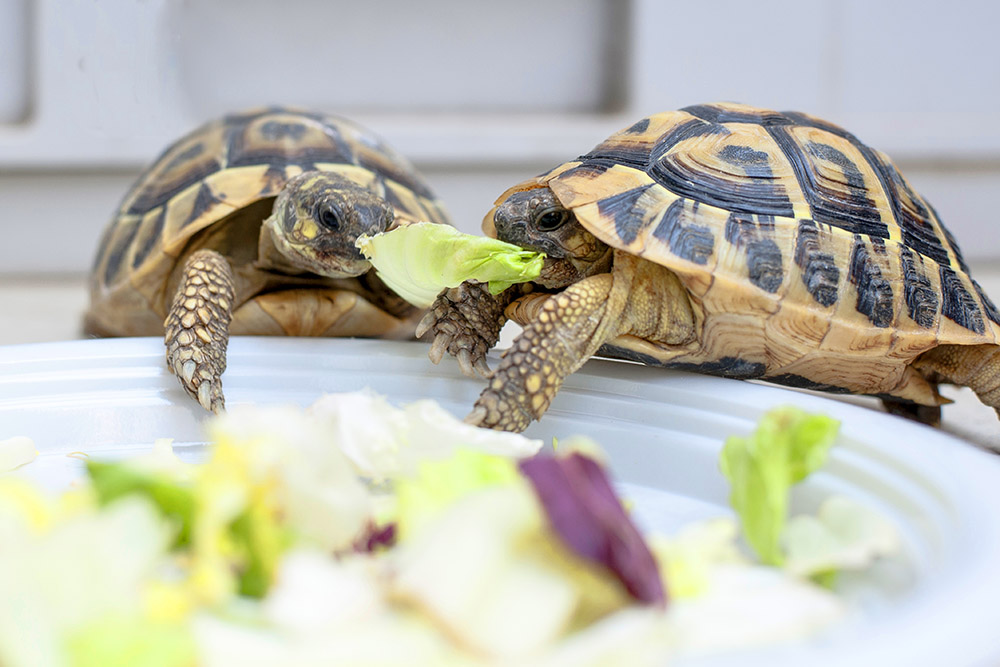
Competition
organisms try to utilize the same limited resources

Cooperation
Organisms benefit each other in some manner
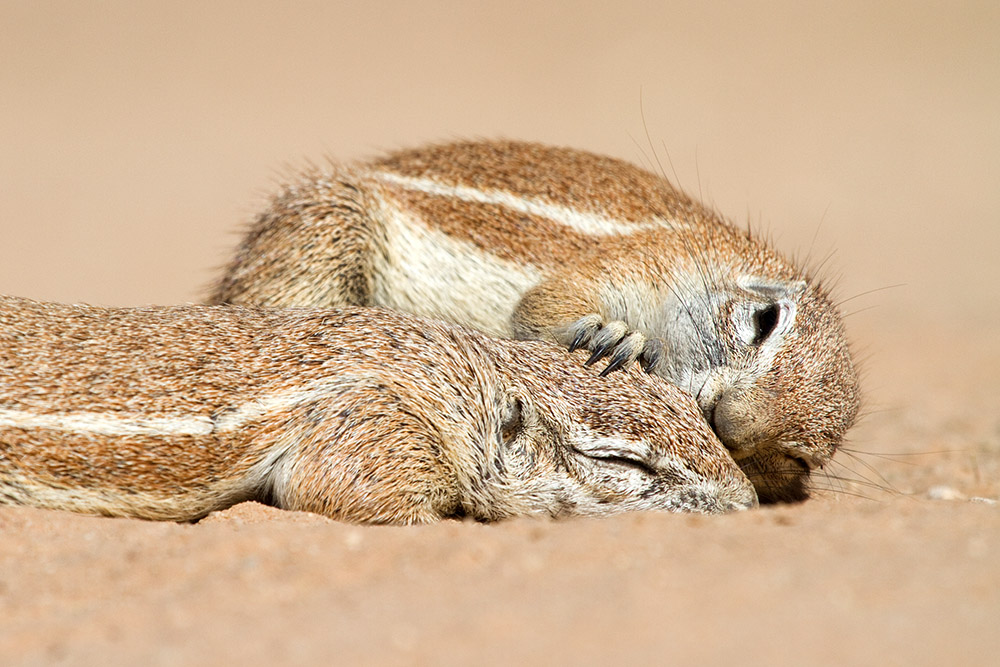
Altruism
An organism is harmed assisting another organism

Undetermined
Many interactions are difficult to study and/or characterize
Start this Guide’s first journal page here
Journal Page #3: Data Collection Plan
For this journal page you are creating a data collection plan that you will use for the next journal page.
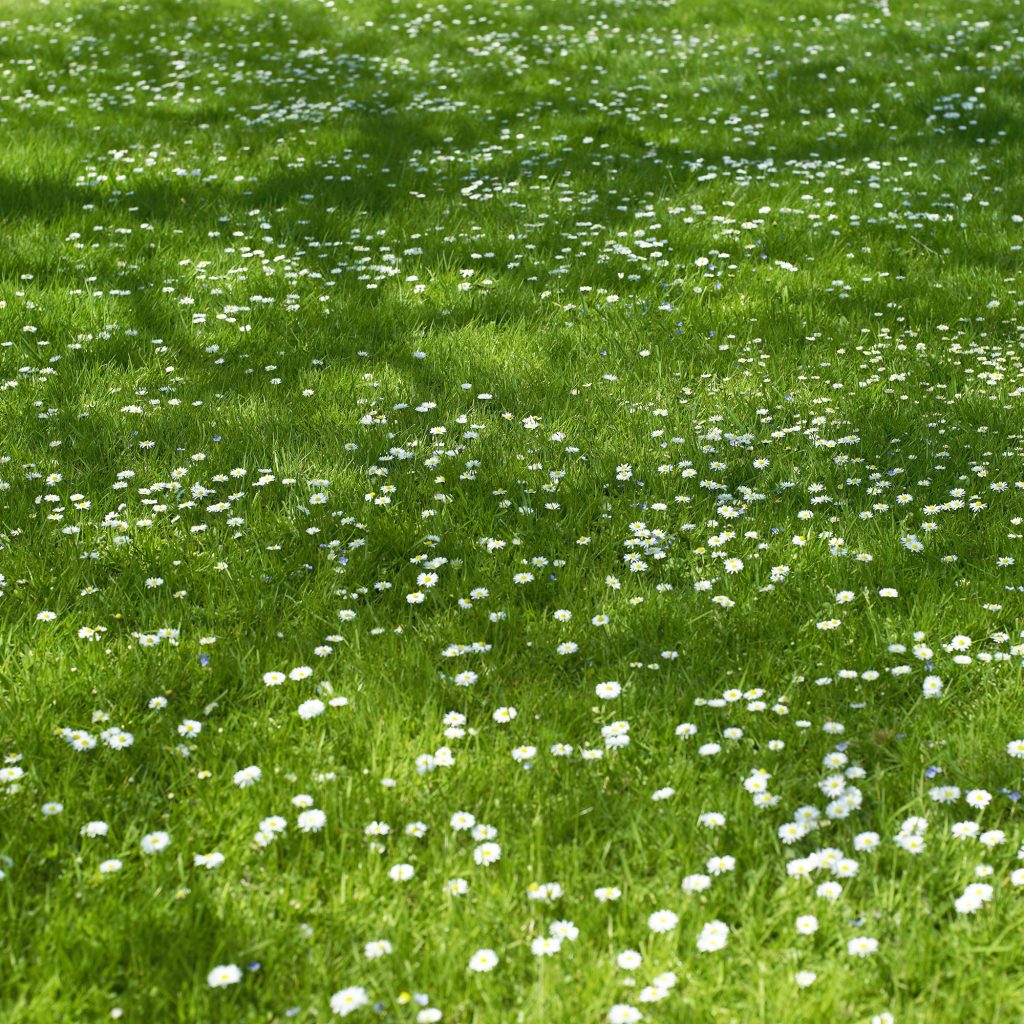
Choose a location with a population of organisms. It can be a yard, field, or somewhere indoors like a carpeted room. The species can be plant, animal, or fungus.
Determine the approximate size of the entire location/habitat, and the size of the smaller area you will sample at that location.
Design a quadrat to sample with, list any other supply needs, and identify potential safety issues.
We are providing the research questions that you will be supplying data to answer:
-
What is the population size? (population data is described in the next section)
-
How is the population distributed?
-
Is there any evidence of interactions within the population and/or interactions of the population with other species?
Upload to Canvas a journal page that includes:
-
The name of the location that you will be sampling (can be map coordinates, name of a park, type of room, etc.)
-
The name of the organism you will be sampling (does not need to be an animal)
-
The approximate size of the overall location you are sampling.
-
The size of the smaller area you will sample at that location, including the design of the quadrat you will use to sample.
-
A list of any additional supply needs.
-
A list of any potential safety issues.
Be safe, travel with others if possible, and minimize impact to organisms and their environments.
Data Analysis
There are different forms of data analysis to try to get a fuller picture of a natural phenomenon. Contemporary data analysis utilizes faster computing speed and rapid communications.

Data Triangulation
Data triangulation is using at least three (or more) perspectives in the analysis process. This could mean different researchers conducting research on the same topic, or a single research lab collecting and analyzing data in different ways.
Data Percolation
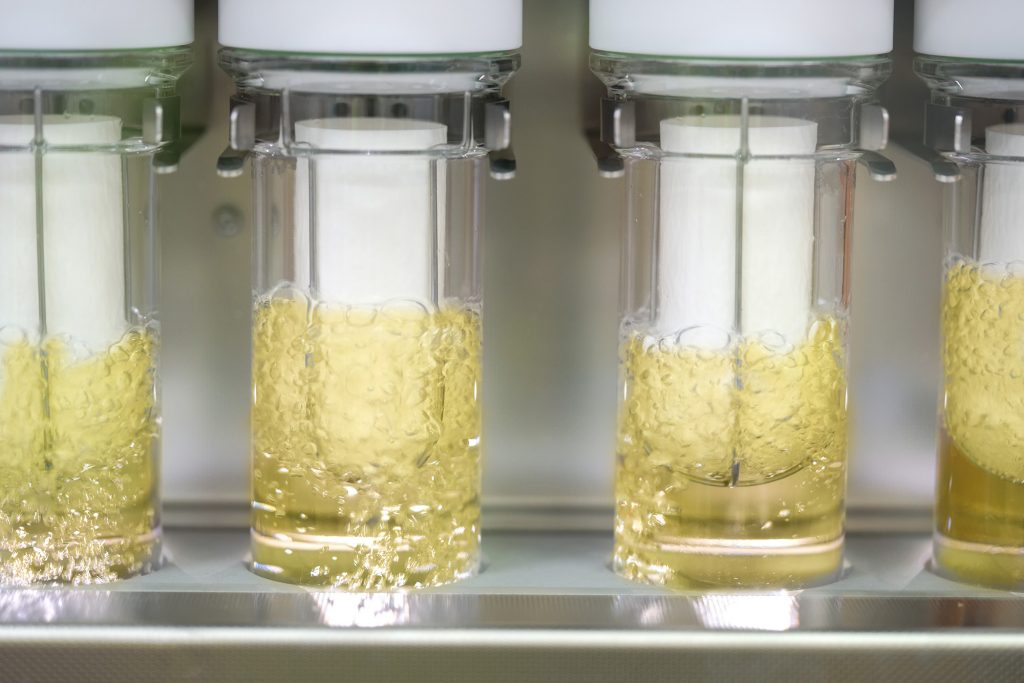
Data percolation is an attempt to get as much useful information out of a raw data set as possible by using a variety of data collection methods (qualitative and quantitative), drawing from published research or interviews with other experts, and running varied statistical analyses.
We are living in the age of Big Data, data sets that are so large, traditional spreadsheet and statistical software is inadequate. Innovations are occurring related to capturing, storing, analyzing, and communicating data.
Start Journal Assignment #4 Here
Journal Page #4: Quadrat Results
For this journal page you are collecting and submitting written data based on the plan you submitted for journal page #3.
You are collecting data to answer:
-
What is the population size?
-
How is the population distributed?
-
Is there evidence of interactions within the population and/or interactions of the population with other species?
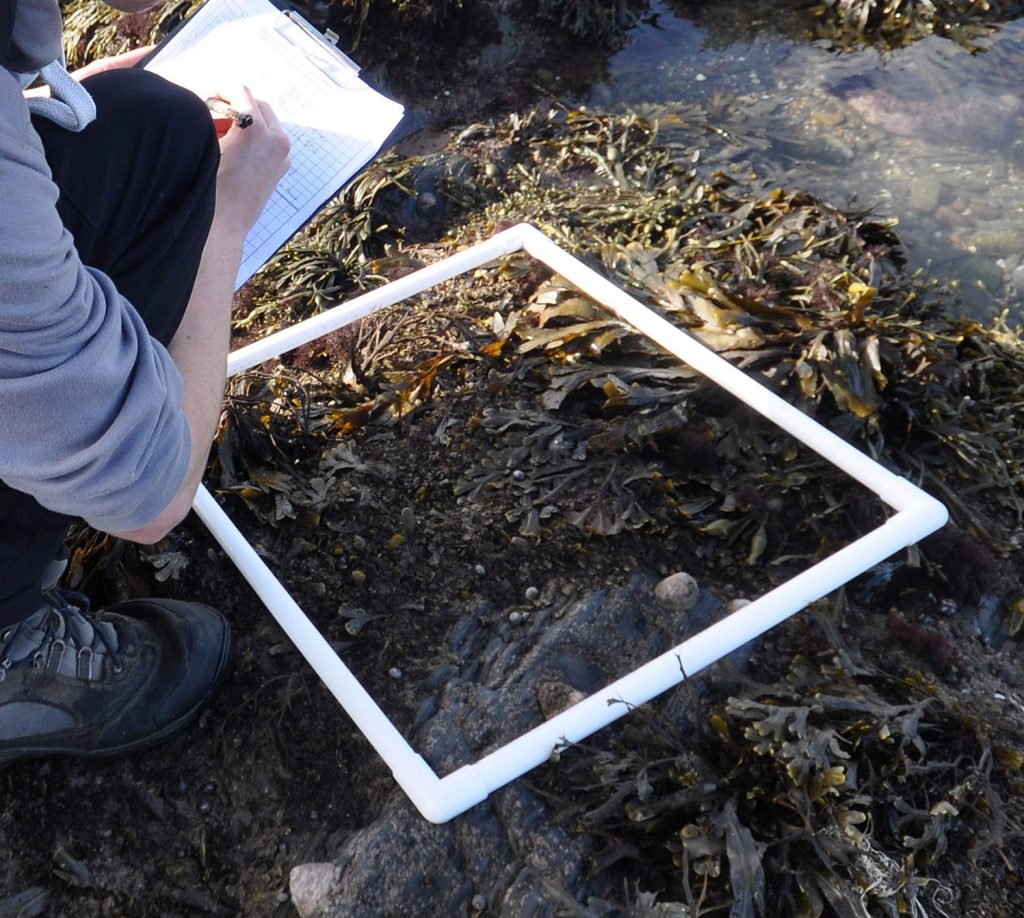
Construct and use a quadrat to sample a portion of the larger space. The quadrat could be string, rulers, pencils, etc. Just keep track of the size of the quadrat.
Collect data on the organisms in the quadrat, then move the quadrat to another area and repeat. The data can include: number or organisms, their distribution, and which other organisms they are interacting with.
Write up your results, including: researcher name(s), project name, location, weather, date, time, the number in the sample quadrat, the extrapolated number in the entire location, distribution, and interactions. Use a combination of writing and images (photos and/or sketches).
In biology, one of the most famous examples of data collection and analysis is the work of Gregor Mendel. Meet Mendel in the next section.
Check your knowledge. Can you:
- provide examples of different forms of data about the natural world, including the types of information data can convey?
- discuss the techniques, benefits, and limitations of sampling from a larger population?
- analyze different forms of population data including population distribution and population size?


