Guide 4 Technologies
Products
Quiz and Journal Pages
Review Guide 4 Contents
Guide 4 Technologies Objectives
This guide’s quiz has four questions; one matching each objective.
Protein Synthesis
Explain what a gene is and how it relates to DNA structure; describe what occurs in the process of transcription, and translation; and provide examples of the functions proteins play in animals, including how structure relates to these functions.
Genomes
Provide examples of different forms of data about the natural world, including the types of information data can convey; discuss the techniques, benefits, and limitations of sampling from a larger population; and analyze different forms of population data including population distribution and population size.
Gene Editing
Match different forms of visualization with the information that is being conveyed; diagram the steps involved in cutting, copying, and moving pieces of DNA; and describe what gene editing is, where the process originated, and the impact of precise DNA manipulation.
GMOs
Describe the types of genetically modified organisms that have been produced, the techniques used, and rationales provide the characteristics of fish, including key structures used to distinguish fish from other living vertebrates; and describe the role of fish hatcheries in maintaining genetically modified fish as well as native species.
Guide 4 Technologies Quiz
Journal Assignment #7
Introduced in the Protein Synthesis section of this guide:
Journal Page #7: Protein Synthesis Drawing
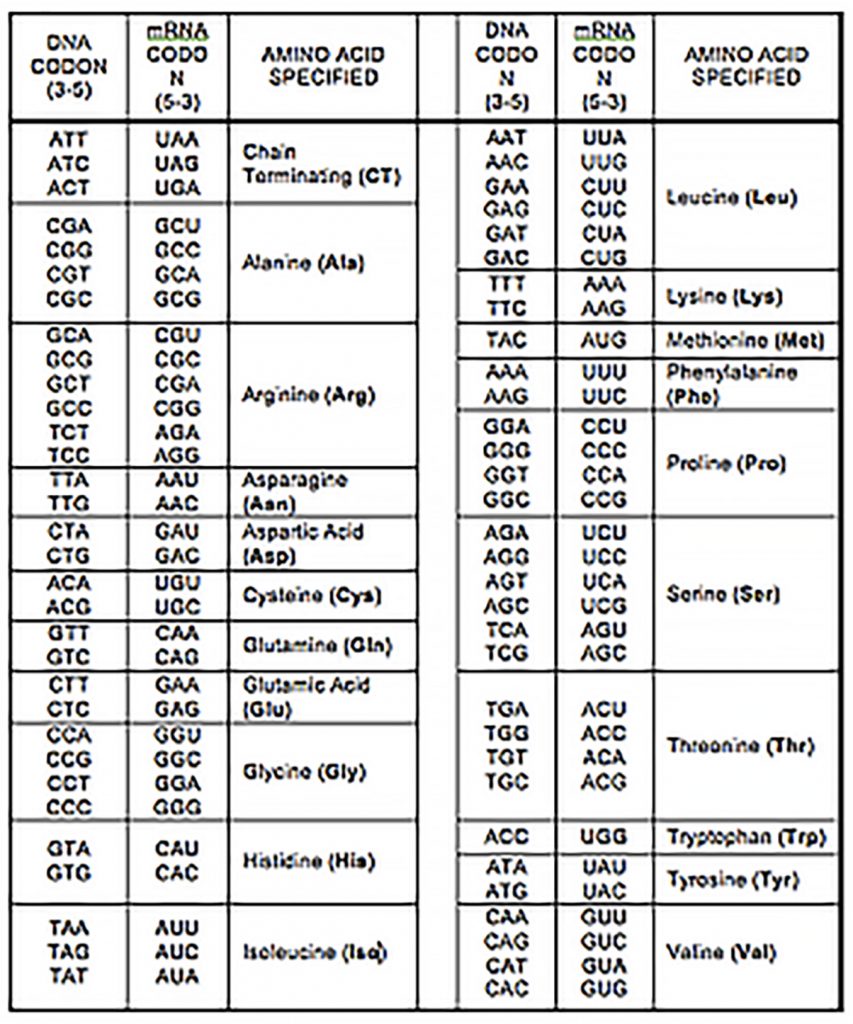
For this journal page you are making an original labeled drawing of protein synthesis. Sketch/draw the synthesis of a hypothetical protein fragment within a cell. Include the following labeled elements:
-
cell
-
nucleus
-
cytoplasm
-
amino acids
-
the DNA sequence of CGT-CCA-CGT-CCA
-
the corresponding mRNA sequence
-
the specific amino acid sequence produced (mini polypeptide)
-
ribosome (rRNA)
-
tRNA
-
nucleotides in a codon
-
transcription
-
translation
Journal Assignment #8
Introduced in the Gene Editing section of this guide:
Journal Page #8: Data Visualization
For this journal page, you are producing a data visualization. This could be your quadrat data, data you already have collected in the past, or new data you collect for this assignment. The data does not need to be related to animals, but does need to be related to some type of natural phenomenon. For example, you could use weather data, the number of hours a pet sleeps, calories in a daily diet, the size of populations in different areas, etc.
Your data visualization needs to:
-
be in a figure format that you feel accurately represents the data. This could be a line chart, bar chart, scatterplot, pie chart, histogram, cartogram (map), or something less conventional.
-
clearly present the data with a title, labels, and/or key as needed.
-
have an engaging design that captures attention. This could be color, patterns, texture, 3D modeling, a witty shape, or whatever you create.
